Checking in at the quarter mile mark
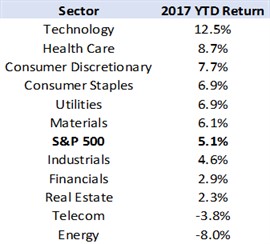
With about 1/4th of the year almost over, I thought it would be good to check in on what market sectors are performing the best and worst thus far in 2017. Below is a table that shows the S&P 500 return YTD and each sector of the S&P 500. It is interesting to note that the sector that most Wall Street strategists recommended buying at the start of this year (financials) is underperforming the overall market. Also, other so-called “Trump Trade” sectors such as industrials and energy are underperforming so far. On the other side of the coin, consumer staples and utilities were universally unloved by this same group, yet they are outperforming the S&P 500. We don’t want to draw too much from this but it is nonetheless something to note, especially considering how often we hear about narratives in regards to price action on Wall Street. See the previous 2017 Stock Market Contest Blog
Smartphones killed the television star
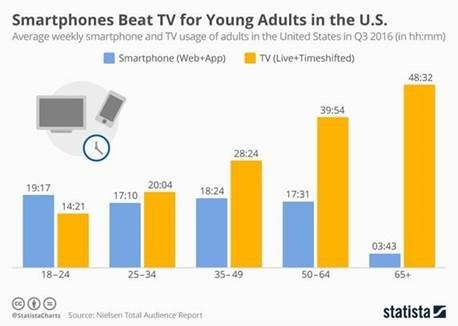
According to the chart below, Generation Z and younger Millennials are now spending more time on their smartphones than watching TV. This shouldn’t come as a surprise with the advent of smartphones and apps such as Hulu, Netflix, Twitter and YouTube. As a kid (I am 28 now), I remember anxiously awaiting for SportsCenter to come on every night to watch all the best plays and highlights of the day. With the abovementioned smartphone apps, I no longer have to wait. Cable companies continue to feel pressure as consumers continue to “cut the cord” or cancel their cable TV packages. Per NYU marketing professor Scott Galloway, more Millennials have subscriptions to Netflix than they do cable TV subscriptions. Consumers continue to crave content on demand and this trend does not show any signs of slowing down anytime soon. Listen to: Scott Galloway on the Masters in Business Bloomberg Podcast
NCAA March Madness by the numbers
With the Final Four upon us this upcoming weekend, I thought it would be good to share some thought-provoking statistics regarding the annual tournament. Hopefully your bracket is still intact.
- The estimated loss of productivity during the tournament is about $4B (shhh don’t tell my bosses!)
- The odds of filling out a perfect bracket are 1 in 9,200,000,000,000,000,000 (this is not a typo, no wonder Warren Buffet confidently offered $1B to anyone who could pick a perfect bracket)
- There is a 19% increase in pizza orders and a 9% increase in dessert orders by fans after losses versus wins
- In 2016, 70M brackets were filled out while 129M ballots were cast in the recent U.S. presidential election
READ MORE: 2017 NCAA March Madness By The Numbers
I hope you enjoyed reading the guest version of the Carnegie Market Blog. If you didn’t like the guest blog, have no worries as Brent will be back next week.