The Great Debate
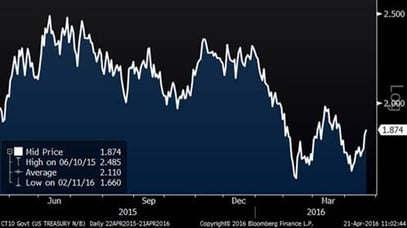
There has been much debate on whether rates are going to rise or stay at historical lows and every time the Federal Reserve does something (or nothing), many of those paying attention seem to disagree. MORE: Yellen will regret slow pace of rate hikes. Below is chart of 10-year Treasury rates over the past year. For the most part, rates have been downward trending, culminating (so far) in the synchronized bottom on February 11.
10-Year U.S. Treasury Rates (One Year)
Rate Hike Odds
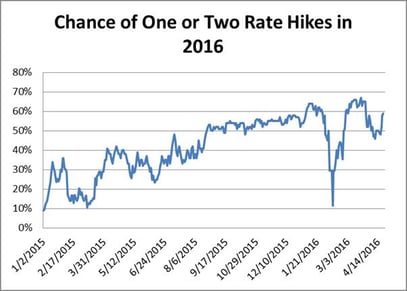
The chart below shows the odds of either one or two rate hikes (the two most likely scenarios this year). As you can see, expectations have been generally rising, except for during the strong market decline. Not coincidentally, the bottom in interest rate expectations coincided with the “synchronized bottom” referred to above.
Interest Rate Sensitive Stocks
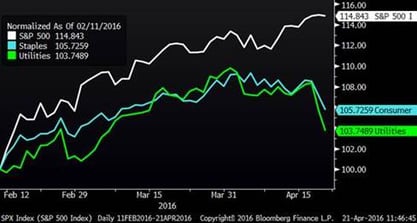
Since the February bottom, interest rate sensitive stocks like consumer staples and utilities have underperformed. This in and of itself is not surprising, since these stocks usually underperform in strong rallies. What is more interesting to me is that in the past few weeks, these stocks have negatively diverged from the rest of the market and are actually down. This suggests to me that the broader market may be beginning to believe in the prospect of higher rates. Another important consideration is that these have been among the strongest sectors as the thirst for yield has driven them to their highest valuations in at least a decade. If investors’ appetite for yield and safety were to mitigate, these stocks might be negatively affected.
S&P 500, Utilities and Staples Since Feb. Low
Jobless Claims
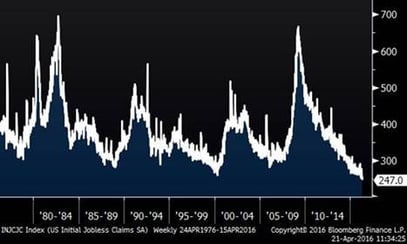
The jobs market is another input that goes into the Federal Reserve’s interest rate decisions. As illustrated in the chart below, the U.S. is now at the lowest level of nominal jobless claims in over 40 years. If this were adjusted for population growth, the ratio of Americans filing jobless claims would be much lower compared to the past. MORE: Jobless claims fall to 42-year low
Jobless Claims (40 years)
Oil Prices
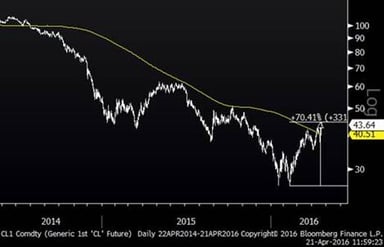
In another topic related to interest rates, oil prices have rallied from their low of $26.05 on (yep, you guessed it) February 11, to $43.65 currently. This reflects a 70% move from the bottom. Lower oil prices had been a deflationary pressure for the last few years, helping to mitigate potential inflation elsewhere. If oil prices are now rising, that would be inflationary, fueling increases in the CPI, and therefore adding pressure on the Fed to raise interest rates. For those of you into technical analysis, you will notice that oil is now above its 200-day moving average for the first time since 2014 when it was around $100. RELATED: Oil prices keep climbing despite lack of output freeze


