Happy Anniversary
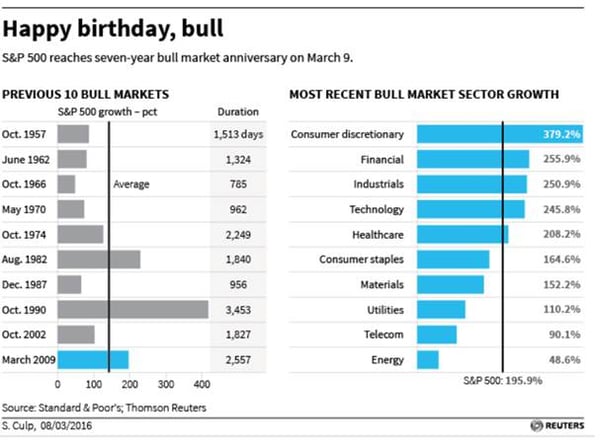
On this day seven years ago, one of the fiercest bear markets in history came to an end. Here are some statistics on the bull market that started that day:
Synchronized Bottom
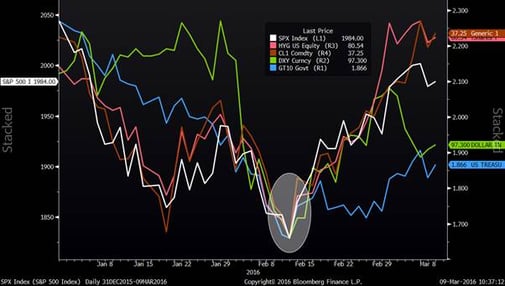
The chart below shows the year-to-date movements of interest rates, stocks, high-yield bonds, oil and the U.S. Dollar. These five instruments do not usually move in tandem. The fact that all five bottomed at the same time is unusual and represents a broad-based shift in sentiment. Sentiment shifts like this are often (but not always) associated with broader market turning points in the associated markets. As always, time will tell…
Rates, Oil, Stocks, Bonds and U.S. Dollar (YTD)
U.S. Oil and Gas Rig Count
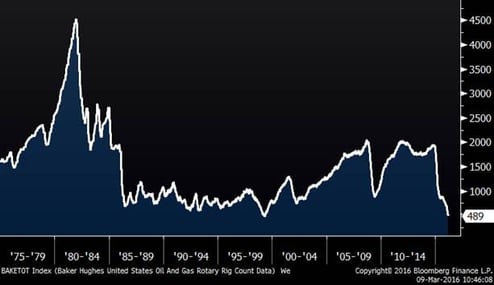
The number of oil rigs in the U.S. is now at the lowest level since they began counting in 1975. Obviously, this measure tends to move with oil prices and with prices down as much as they are, rigs continue to be idled. Interestingly, oil prices have rallied an incredible 45% since the February 11th low. If these prices hold, it will be interesting to see if the decline in rig count finally ends. Related: Plummeting Global Rig Count Could Trigger Oil Supply Crunch
U.S. Rig Count
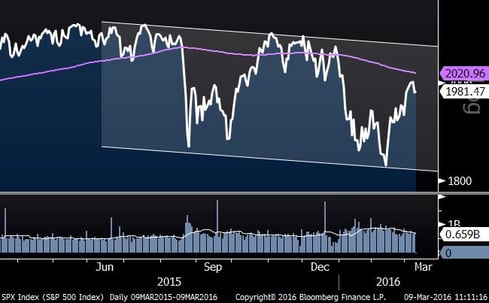
Market Downtrend
Even considering the recent strength in the stock market, it is important to note that the market is still technically in a downtrend over the past year and is trading below its negatively sloped 200-day moving average. A market with these characteristics is not considered bullish. Click July 27, 2015: Market Top or Correctionor December 11, 2015: Are Stocks Headed for a Bear Market? to read a previous Carnegie Market Blogs related to this subject.
S&P 500 (One Year)
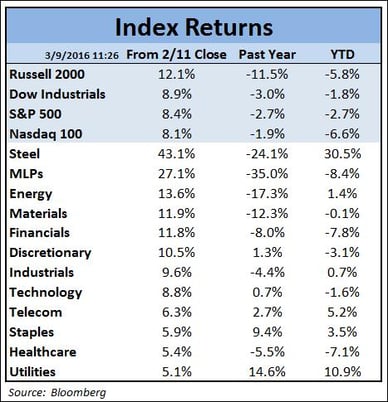
Index Returns
The table below tells us a few things about the market:
- The market has been very strong since the recent bottom, but is still down this year and over the past twelve months.
- Since the bottom, the defensive sectors have been the weakest, but are still strong.
- The materials and energy stocks have been incredibly strong recently, but are still the worst performers over the past year.
- Utilities are up 11% YTD; a very strong move for a normally stable sector.
