Low Beta Underperforming
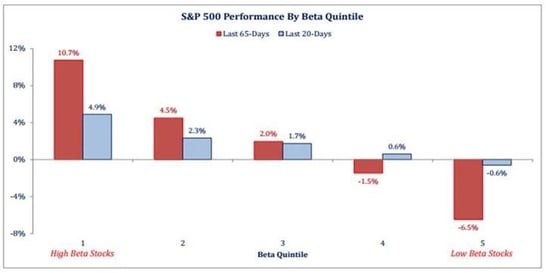
The chart below, from Strategas, highlights the fact that “low beta” stocks have dramatically underperformed “high beta” stocks over the past 65 days. I have talked about this before (Read: The Sleeping Dog has Woken), but the market has become quite comfortable with their allegedly low beta stocks over the last year or two. What they may not realize is that a massive amount of money has chased these stocks, not because they are safe, cheap or have good fundamentals, but because they pay high dividends. Dividends, of course, have become very attractive in such a low interest rate environment. This has potentially made the formerly low beta (remember, beta is a backward looking calculation) stocks into those that carry the most risk if the market begins to believe that interest rates are going higher. This has already happened to some extent. If you look at most staples, REITs, telecom or utilities stocks, which were big winners through July, they are all down measurablyfrom their highs and have been weaker than the general market.

Internet Minute
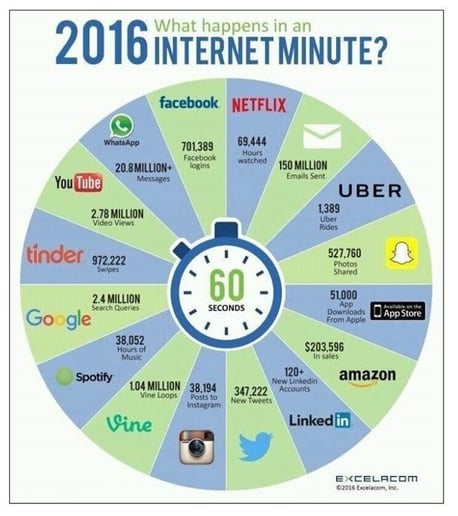
I came across the following chart the other day. It shows a snapshot of what happens on some of the most popular apps in a typical minute, I thought some of you might find this interesting. It would be interesting to see what this looked like ten years ago; I can’t imagine what it will look like ten years from now!

Correlated Indices
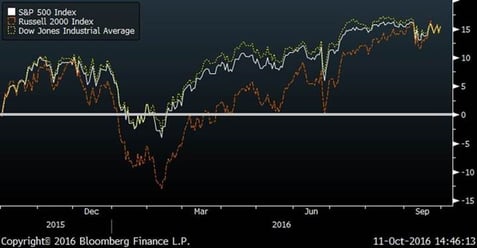
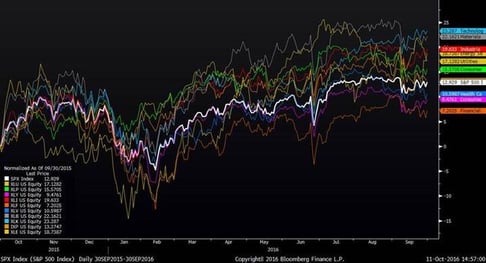
For the past twelve months, the S&P 500, Russell 2000, and Dow Jones Industrial average have returned (including dividends), 15.42%, 15.46% and 15.46% respectively. Looking at the chart below, which one had the worst risk adjusted return? Given that all three of these indices, which presumably reflect three different themes within the market, are so close together, one should infer that most sectors and portfolios will have returns similar to this, too, right? Well, not necessarily. The chart at the bottom shows each sector over the past year. Over the past year, technology is leading the way, up 23%, while financials have been the worst performing sector. Interestingly, only three sectors lagged the S&P 500: healthcare, consumer discretionary and financials.
Major Indices (Trailing 12 month returns)

Sector Returns (Trailing 12 Months)

A.I.
No good blog can be sent without a reference to Artificial Intelligence. For those of you who missed 60 minutes this week, check how Watson has gone from winning Jeopardy to fighting cancer:


