NOWHERE TO HIDE
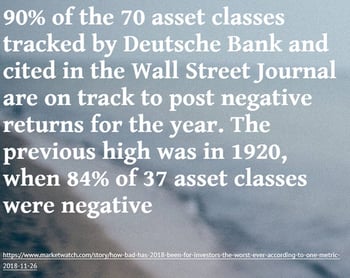
This year, 90% of asset classes are down. If the year ends this way, it would be an all-time record. This includes the Great Depression and the Great Recession. Read More: Why 2018 Has Been The Worst Year Ever, According To One Metric
INVERTED YIELD CURVE
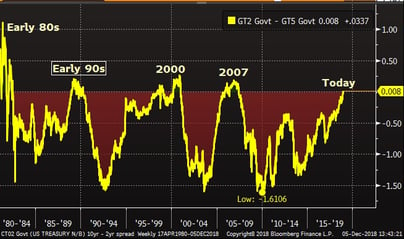
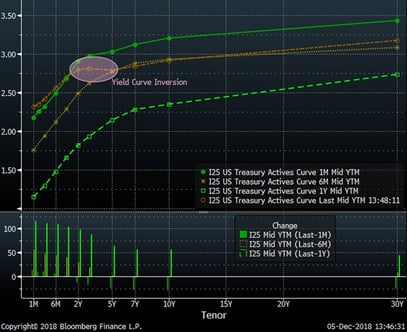
One of the current worries (one of many) is the recently inverted yield curve. Earlier this week, a portion of the yield curve became inverted with the five-year Treasury yield now being below the yield of the two-year Treasury. When this happened, the market immediately plummeted – the new reality of ETF investing and computer-based trading makes moves down very sharp and quick now. Why does the market dislike this inverted yield curve so much? Historically, an inverted yield curve typically precedes a recession for the U.S. economy. As you can see in the chart below, this occurred in the early 80s, the early 90s, before the recession of 2000-2003, before 2008 and now. It is worth noting that currently only a small portion of the yield curve is inverted, but it certainly caught the attention of already fearful market participants. Also of interest is the fact that in all of these periods, the market had positive returns in the period between the curve inversion and the beginning of the recession. What The Heck is an Inverted Yield Curve? Click Here to Learn More
Spread of 2-Year and 5-Year Treasury Yields
Yield Curves Over the Past Year (Brown is Now)
FED FUNDS RATE
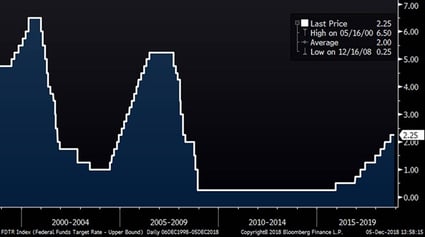
One of the big unknowns/fears in the market has been related to the Fed and their current tightening cycle. The flattening/inverting yield curve, along with slightly weaker economic data probably means that we are nearing the end of this tightening cycle. Below is a chart of the Fed Funds rate. As you can see, they have been consistently raising the target rate for two plus years now. Click Here to Read Yesterday's Fed Beige Book, which is an important tool in helping the Fed determine economic trends. Note that there is evidence of a little bit of slowing.
Fed Funds Target Rate (20 Years)
MARKET VALUATION
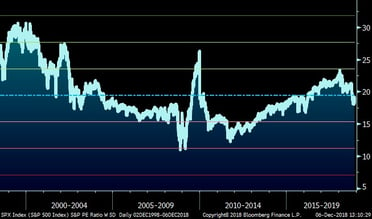
The chart below shows the P/E ratio of the S&P 500 over the past twenty years. Interestingly, the recent move down in the market has moved this ratio from 23.5 to around 18, which is below the average over the last twenty years. The big worry in the markets is whether the denominator (earnings) will fall.
S&P 500 P/E Ratio (20 Years)
ARTIFICIAL INTELLIGENCE
Anyone who knows me knows that I am a big believer that artificial intelligence is part of a major secular trend and a technology revolution that we are in the second inning of. Click Here To Learn More From 10 Essential Ted Talks On AI

Have a great day!


