Happy St. Patrick’s Day
Today is a big day in Cleveland, Ohio. Our St. Patrick’s day celebration, which started in 1867, is one of the oldest and largest in the country with over 500,000 people all converging on downtown Cleveland. For those taking notes, 500,000 is now more than the population of Cleveland proper.

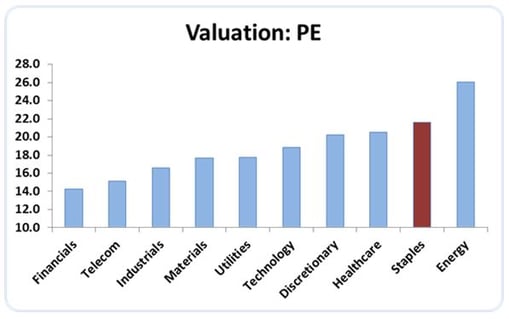
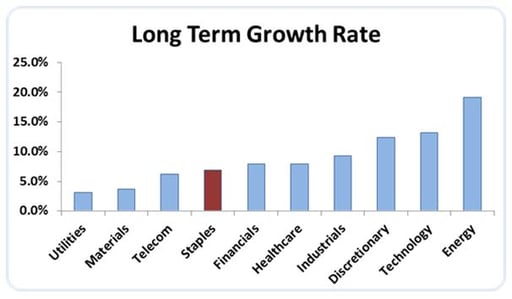
Sector Valuations
The charts below show current S&P sector valuations and their projected long-term growth rates. Energy is in a state of flux, so that sector can probably be discounted. In looking at individual stocks it has been clear that money has been chasing yield. As a result, stocks with high and consistent dividend payments have been bid up. In many cases, the current prices represent the highest valuation multiples ever, or at least in the past 10-20 years. Typically, valuation multiples are correlated to long-term growth rates, so it would be reasonable to expect the sectors with higher growth rates to also have higher valuations and vice versa. What strikes me as being most unusual in the charts below is the fact that outside of energy (which is skewed right now), consumer staple stocks are the highest priced S&P sector, but the anticipated growth is only expected to be about 7% annually, which is among the slowest growing S&P sectors.


Market Goes Positive on the Year
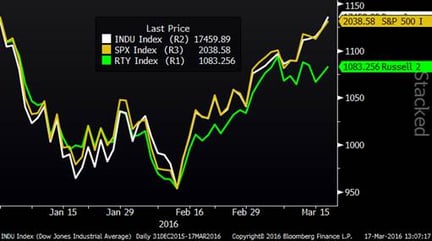
The S&P 500 and Dow Jones Industrials are now up on the year. As bad as this year has felt for many investors, if you had gone off the grid on December 31st and came back today, it would seem like nothing has changed. In the meantime, there was a 15% decline and subsequent rally. In the chart below, you can clearly see the synchronized bottom I discussed in the last blog. Moves like we have seen this year typically create dispersion in investment manager results as some sold in fear while others bought opportunistically. One other note related to the chart below is that smaller capitalization stocks have lagged in the recent rally, which implies that the median stock is probably still down for the year and that the market has likely been led by a smaller group of larger capitalization stocks.
S&P, Dow and Russell 2000 YTD

U.S. Dollar
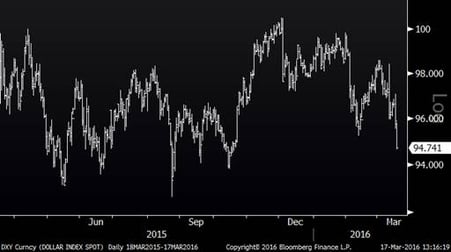
The U.S. Dollar Index is at the lowest level in six months and is now down on a year-over-year basis. A year ago, after rocketing higher for nine months, almost everyone expected the index to keep moving higher. If the U.S. Dollar continues to fade, it should theoretically be good for U.S. industrial companies and others with significant revenues derived from overseas. Related: Dollar Falls After Dovish Fed Statement


