.png?width=1024&name=Carnegie%20Blog%20Post%20Header%20Template%20(8).png)
Anyone who follows the equity markets on a stock by stock (or company by company) basis (like me) has likely noticed that the market has experienced a clear shift in behavior since early September.
Some examples of this include:
- Significant strength in the Financial sector with many financial stocks hitting all-time highs
- Significant strength in Industrials, with many at new highs
- A clear shift toward value stocks and away from smaller/newer growth stocks
- A shift away from the previous winners and into the previous losers
- Many of the “S-Curve” plays – see blog from 11/4/19 – have declined
- Weakness in REITS, utilities and consumer staples stocks
- All-time highs in the major market indices
All of this happened at a time when pessimism was high, and the media was focused on fears like negative interest rates, the inverted yield curve, tariffs, recession and other issues.
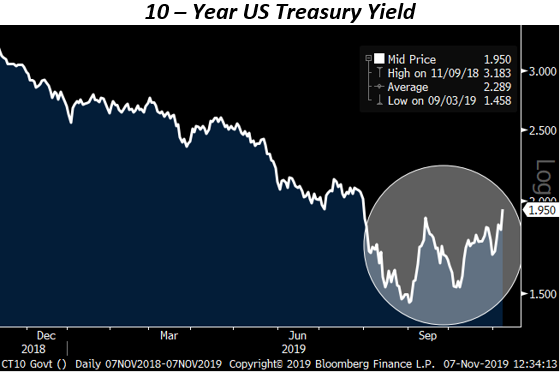
At the same time these equity market behaviors changed, plummeting interest rates reversed, and have been up trending ever since:

Before this change in behavior, a major media focus was the inverted yield curve. This happens when short-term yields are higher than long-term yields. Many believe this is strongest of all recession predictors, when 10-year yields are lower than two-year yields, this is not normal and implies that a recession is likely ahead.
The fact that the yield curve was inverted was a big headline and one that successfully garnered an emotional response from many market participants.
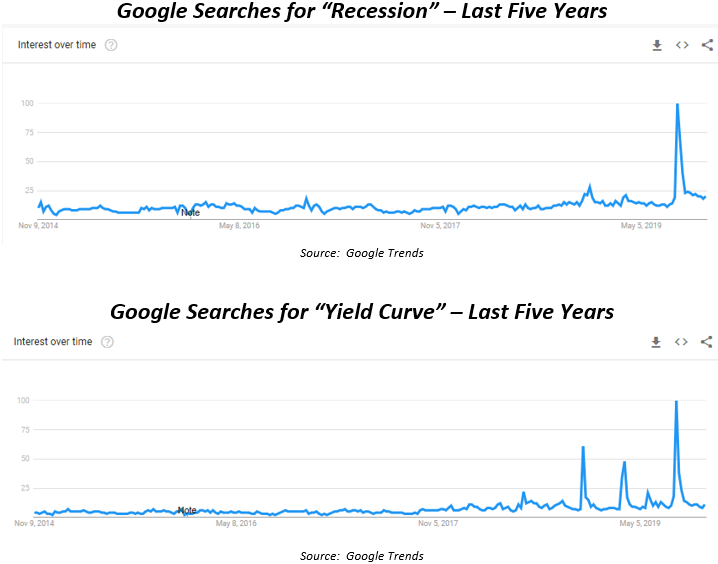
Check out the charts below showing Google searches for the term “yield curve” and “recession” by the general U.S. population:

As you can see, there was great concern about an impending recession and the inverted yield curve. I can only guess that most people were exposed to this by the media.
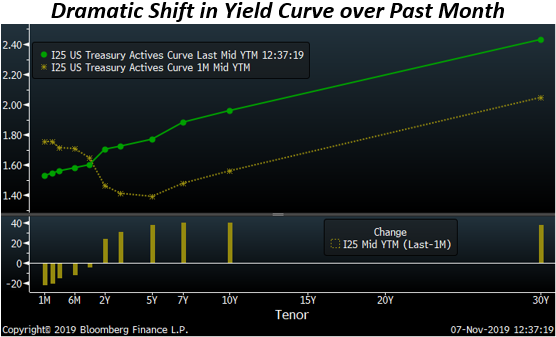
The chart below shows the yield curve a month ago (brownish green) and the yield curve today (bright green).
What you will notice in this chart is something very important, and a dramatic change in just one month.

In only a month, the yield curve has shifted from the ominous inversion to a completely normal yield curve that would typical be seen in an expansionary and healthy economy.
This should be very big news that is plastered all over the mainstream media. Why isn’t it? That's because “hey everyone, things are going to be okay,” does not attract clicks and eyeballs. Fear does. In fact, I have not heard one mention of the now “normal” yield curve in mainstream media.
So what does all of this mean?
These changes suggest that the financial markets have shifted their expectations.
Most of the fears surrounding tariffs, interest rates, and especially a recession have apparently waned.
For the first time in a while, the yield curve is suggesting that the economy will be healthy and that we will NOT go into a recession, contrary to what a majority of people projected just a month or so ago.
This change is being manifested in the bullet points at the beginning of this email. Industrials are strong because people no longer believe a recession is imminent and that the trade war is in its final innings. Financial stocks are strong because the yield curve is suddenly very healthy, and thereby good for banks. The previous losers are strong because most of the laggards were down on these fears – now they seem cheap and money is flowing back into them. REITS, utilities and staples were a safe haven and these stocks like lower interest rates, so now money is no longer flooding in.
So if you are wondering how on earth the market can be hitting new highs given all of the things to be afraid of, consider the things I mentioned above. Has something changed?
Do you have thoughts or questions regarding this article?
Contact the author, Brent Luce, at bluce@carnegieinvest.com.


