.jpg?width=1024&name=Carnegie%20Blog%20Post%20Header%20Template%20(2).jpg)
The last few months have not been an easy ride for equity investors. The S&P 500, Nasdaq and Russell 2000 all went into bear markets, which is typically defined as a decline of 20% from their all-time high. Combing through some data, I thought I’d share some interesting anecdotes I learned and what it could mean moving forward.
Investors ran for the exits
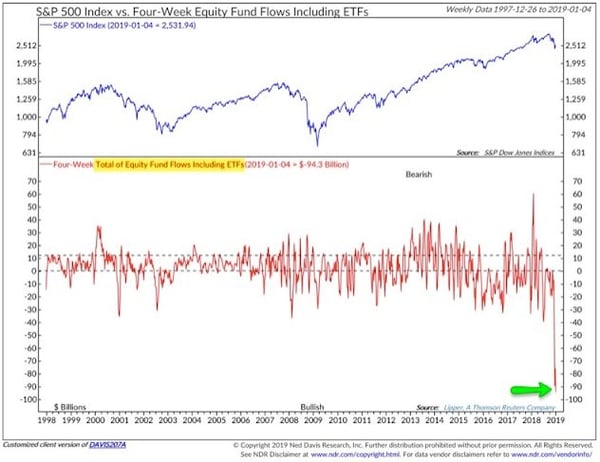
Below is a chart from Ned Davis Research that shows that December 2018 had the highest monthly outflow for equity funds (includes ETFs) in the last 20 years. In the simplest sense, investors were probably selling any kind of exposure that had to stocks.

Source: Ned Davis Research
Worries over slowing global economic growth, Brexit, an inverting yield curve and a trade war with China stoked much fear. As you can see, there seems to be a correlation between extreme outflows and market bottoms.
Investors shifted to cash pretty quickly
According to data from the Investment Company Institute, the amount of cash in money market funds rose by $155 billion in most recent quarter. This is the biggest increase since December 2008. That time period was a perilous one as it was right after the bankruptcy of Lehman Brothers and the midst of the Great Recession. The stock market eventually bottomed in March 2009.
Company insiders were buying
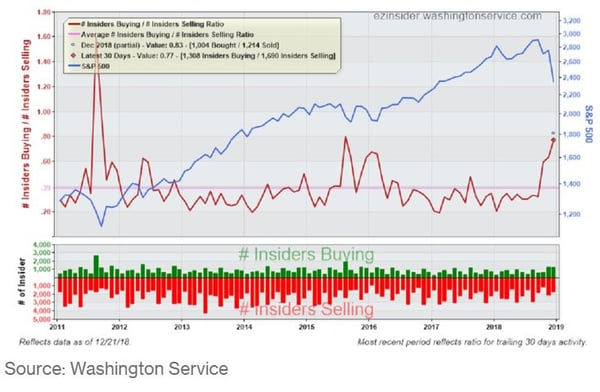
There is no one indicator that gives you the “all clear” to buy or sell stocks but I do find it interesting when company insiders buy stock in their company. Insiders can sell for many reasons, but they usually are buying for one reason: they think the shares are undervalued. Company insiders know their companies well so at times it is worth paying attention to. The below chart from Washington Service showed that as of December 21st corporate insider buying was at its highest level since August 2011 (which coincided with the European debt crisis and the U.S. credit downgrade).

As you can see, the red line shows the number of corporate insiders buying increasing as the stock market was declining. Again, this doesn’t guarantee a “market bottom” but it reflects the confidence that insiders had in their companies despite the turbulence in the stock market.
Investors were scared
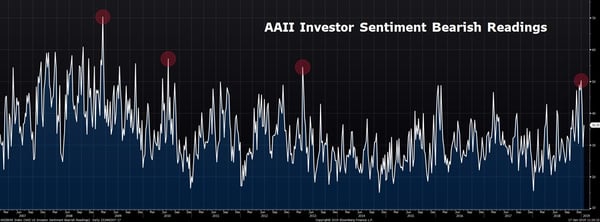
This shouldn’t come as a surprise as the pain of loss is felt twice as worse than the pleasure of gains. The American Association of Individual Investors (AAII) conducts a weekly survey of its members where they ask if they are bullish, neutral or bearish on the stock market for the next six months. Below is a chart from Bloomberg that shows the weekly bearish readings.

Source: Bloomberg
During the last week of December, the percentage of bearish respondents was 50%, which is a two standard deviation event (this means it doesn’t happen often). Consider that the historical average for bearish readings is 30.5%. According to AAII, the median 12-month forward return for the S&P 500 is +14.3% with a two standard deviation event. This was the highest bearish reading since 2013 and the red circles indicate the highest readings since 2009. Again, this is not a “all clear” indicator as there were similarly high readings in 2007 and 2008, right before and during the Great Recession.
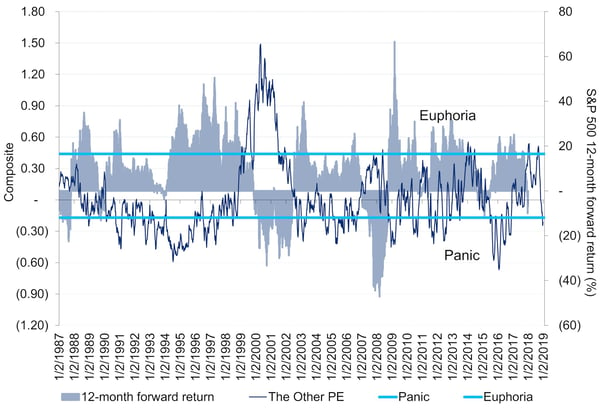
Another interesting sentiment study is a model that Citigroup developed called “Panic/Euphoria”. This model is made up of many inputs which include margin debt, trading volume and options activity. “Euphoria” readings usually coincide with market declines as there is excessive optimism in the market while “Panic” readings indicate future market gains as there is a lot of fear. The chart below shows their model went into “Panic” territory in December.

Source: Citigroup
These are just two data points of many to consider but it does give you a good idea that many investors were reacting to the negative headlines and price action in the stock market. The current low of this recent market correction was on December 24th. Time will tell if that was the bottom but since that day the S&P 500 is up about 12%.
What does this all mean?
It doesn’t guarantee that the market is going to rip to new highs but the odds of stock market gains in the future increases as pessimism rises and expectations decline. Valuations are cheaper and dividend yields are higher (both are positive). While this may sound confusing, low expectations in the market are good because it’s easier to beat them.
Think back to the quote from legendary value investor Ben Graham when he said, “In the short-run, the market is a voting machine – reflecting a voter-registration test that requires only money, not intelligent or emotional stability but in the long-run, the market is a weighing machine.” Over certain short periods of time, the market can move in extreme, almost irrational ways to both the upside and downside. Over a long period of time, market prices reflect the proper value of publicly traded companies.
What can investment managers and financial counselors do during times like this?
We have a few options:
- Do nothing
- Sell into the fear/panic and hope/wait for things to turn
- Use the decline to better optimize portfolios and asset allocations
The second option isn’t optimal because it requires you to be right twice, knowing when to sell and knowing when to buy back in. Famed money manager Peter Lynch once said “I’m always fully invested. It’s a great feeling to be caught with your pants up.” The possibility of missing out on gains if you are not invested when the market rebounds can be costly.
The third option seems most logical, as we can do tax-loss swapping (selling stocks/ETFs to capture a tax loss but replace it with a similar security to remain invested in the market). We can also prune weaker stocks and ETFs to purchase more attractive sectors/companies that have come down in price/valuation and re-allocate towards the target asset allocation for clients. Sticking to your asset allocation is important. Properly adjusting it during market declines can be very beneficial. You would be re-allocating assets that may have increased in value or stayed the same (bonds/cash) and investing in assets that have gone down in value (stocks), are cheaper and probably have higher future expected returns. A key differentiator of good investment managers is to not let emotions drive decisions but instead use market declines to the advantage of their clients, which we strive to do every day.
Lastly, market corrections can also be a time to do a check-up on how you react during volatile markets where losses reign. Its easier to say you want to be aggressive during a bull market where most stocks are going up, but were you able to stomach seeing your portfolio go down in value? Does the constant barrage of negative headlines in the media bother you? Will you be more likely to make decisions based on reason or raw emotion during times like this? Does your asset allocation need to change to better protect you during volatile times?
It's helpful to work with an experienced financial professional to answer these questions, rationalize and execute the appropriate actions with your best interests in mind. We are here to help you navigate difficult market environments, while still achieving your long-term goals.


