Oil Prices
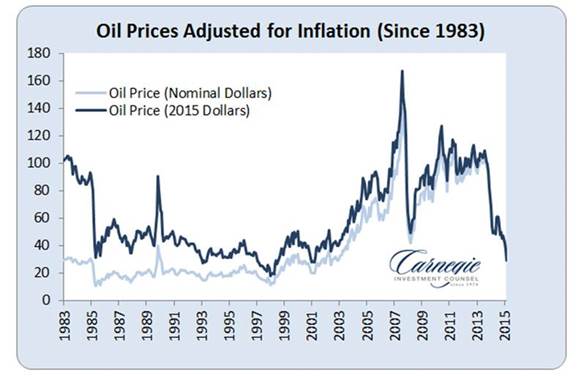
Everyone and their mother (and grandmothers) is talking about oil prices. It has become THE central topic related to the financial markets. Two years ago, Wall Street gurus were calling for $120 oil, seeing almost nothing that could hurt oil prices. Today, these same people are calling for oil to drop to $20 (I have seen as low as $10), with no end in sight and no prospects for higher prices. This behavior is very typical of market and human behavior. Anyhow, there are a couple of topics below related to oil, so I thought I would start with a long-term chart of oil prices, including the inflation adjusted price, which is not shown in most charts. As you can see, real oil prices are as low as they have been in at least 32 years.

Banks Crushed on Energy Loans
As we know, there is a lot of fear in the market, especially related to oil prices and what the fallout of lower oil prices may be. One of the victims of these concerns has been banks with the theory being that their oil and gas loan book will be a problem. For most of the large banks, it turns out that these loans are a small portion of their total loan portfolio (1-5%). Read More: Big U.S. Banks Brace for Energy Loan Losses as Oil Plunges
Oil’s Effect on Tax Revenues
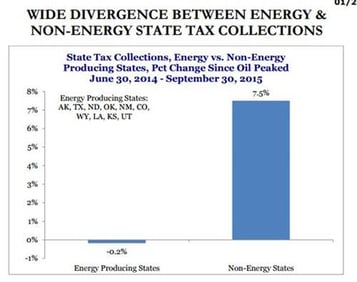
The chart below is interesting. It shows how much of an influence oil prices have had on oil producing states. It is also interesting to me how strong revnues have been in other states. This suggests that outside of energy (and probably other basic materials) the economy has actually been quite strong. Read More: State Tax Revenue Squeezed By Oil Prices

Bull or Bear Market?
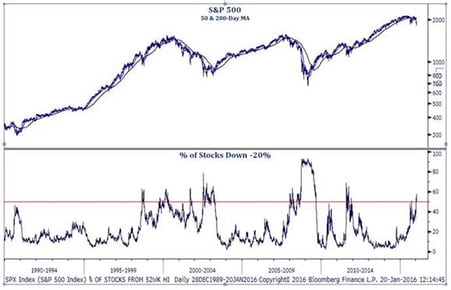
The chart below shows that the number of S&P 500 stocks that are down more than 20% from their highs has spiked to near 60%. This is a fairly rare occurance, last happening in the “head fake” of 2011. Of course this condition is prevalent during bear markets. So, for those expecting a bear market, this is confirmation. For those who do not believe we are entering a major bear market, this would be an indicator that the market is oversold and that now is a good time to buy. In which of these camps are you?

Where are the Bulls?
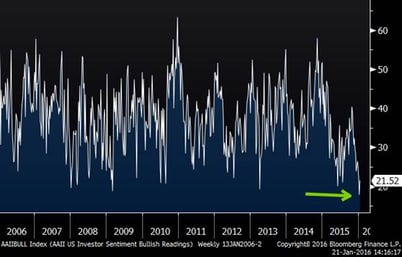
The chart below shows the percentage of bullish investors as surveyed by the AAII. This indicator is now at the lowest level in at least ten years, and is even lower than the low of March 2009. This is a somewhat extreme reading. These types of readings usually correspond with low points in the market. Read More: Optimism at Lowest Level Since 2005
Investor Bullishness (Since 2006)

There are plenty of other interesting things to talk about, including the year-to-date returns of certain indices, but in the interest of keeping this short and sweet, I will save that until next week.


