M&A
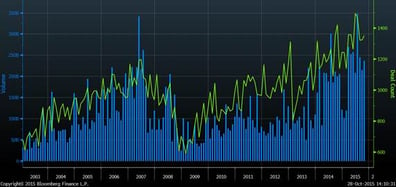
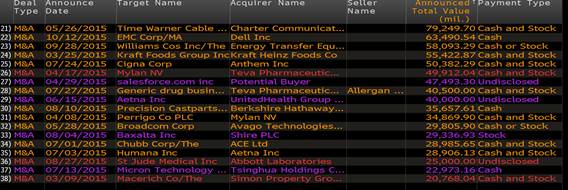
M&A activity remains very strong and, in fact, there were several deals announced today. The chart below shows North American deal volume since 2003. As you can see, M&A activity is higher now than in 2007. In the past, heavy deal volume often coincided with peaks in the stock market. Is this time different? Will this heavy M&A activity continue?
North American M&A Activity (Since 2003)

Largest Recent Deals

The Fed
The market weakened this afternoon after being strong all day. The move down was a result of the Fed interest rate decision. They of course did not raise rates, but they did change their language to imply that there is an increased chance that they will do so in December. The afternoon move down was not dramatic, and actually reversed, suggesting that the market may be more accepting than it has been of an impending interest rate hike.
Energy Sentiment
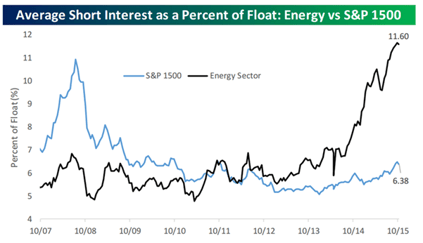
As you probably guessed, sentiment toward energy stocks is extremely negative. The chart below shows short-interest within the Energy sector. Short-interest represents the number of shares that market participants have sold short. As you can see, short-interest in the space is the highest it has been in a long time (perhaps ever), and investors are more negative on energy now than they were on the overall market back in 2008. Usually, extremely negative sentiment creates good buying opportunities, but one thing I notice about this chart is that there is no indication that the currently high short-interest is necessarily a peak. Will the sentiment in energy continue to deteriorate?

Market Performance
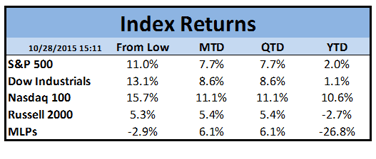
As I type this (3:00pm EST), the S&P 500 is up almost 8% for the month of October. The fears that surfaced in August and September have waned and the market is within four percent of its all-time high set in May. The chart below shows returns from the market low on 8/25. Outside of the general market strength, two things grab my attention: The MLP space is actually down since the market low and the Nasdaq 100 has been extremely strong, aided by sizeable advances by Amazon, Microsoft, Google and others.

Pumpkin Roll
In non-investment related news, by the time you receive your next blog, the Annual Pumpkin Roll will have occurred in my home town. This highly secretive (not so secretive these days) tradition traces its roots back almost fifty years. Each year, students of Chagrin Falls High School “attain” and secretly store hundreds of pumpkins and then unleash them on the town late on an unannounced autumn evening. Click here to view a video of last year's pumpkin roll


