I pondered whether I should hold back this blog, since it will make two in a week, but my guess is that readership will be low next week given the holiday. I am hoping some of you will find the first bullet point interesting enough to quiz the family with during Thanksgiving break.
Deep Thoughts...
If you fold a typical piece of paper in half 42 times, the height of that folded paper would reach the moon. Of course the 43rd fold would go to the moon and back. To most people, this just does not seem possible because our brains are trained to think linearly instead of exponentially. This is cool, but does it relate to investments? Of course it does! The height of the piece of paper is compounding at a rate of 100% per fold. While it is impossible for a portfolio to compound at 100% per year, the same phenomenon relates to investments:
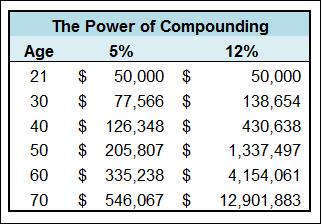
Suppose Johnny inherits $50,000 on his 21st birthday from grandma. At the same time, his cousin Mikey, who was coincidentally born on the same day, receives the same inheritance. Johnny invests his money in a very safe portfolio which turns out to return 5% annually until he is seventy years old. Mikey does the same thing, except he invests in a much more aggressive portfolio that returns 12% each year. Obviously, Mikey will end up with more money, but the magnitude of the difference is remarkable:
Steel Production
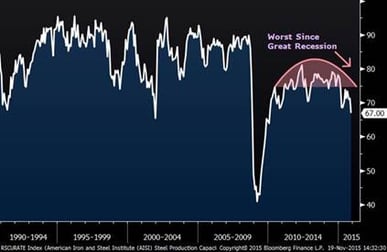
The chart below shows steel capacity utilization over the past 25 years. As you can see, U.S. steel capacity utilization is at its lowest levels since the Great Recession. Typically, this indicator moves with the global economy. This time around, not only has there been slowing growth in places like China, but an expected boom in Chinese consumption encouraged additional supply to come online. Read more in this Bloomberg article.
U.S. Steel Capacity Utilization
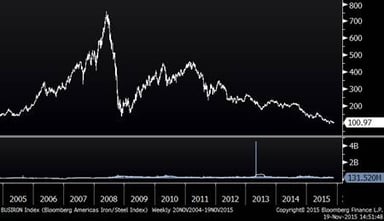
Looking at the actual steel stocks (chart below), the index I follow has slowly dropped to levels even lower than the trough of the Great Recession. In looking at the chart, you will notice that back in 2008, these stocks “fell off a cliff” as the economy screeched to a halt. This time around, it has been a slower process, likely a function of capacity slowly coming online and lackluster demand.
Steel Stocks (Since 2004)
BRIC Stocks
This may come as no come as no surprise, but the BRIC stocks have been very weak over the past five years. It seems that everyone now hates international stocks, including the BRIC stocks, so will the relative outperformance of U.S. stock market continue, or are we due for a reversion to mean?
U.S. Stocks Versus the BRIC Stocks (five years)
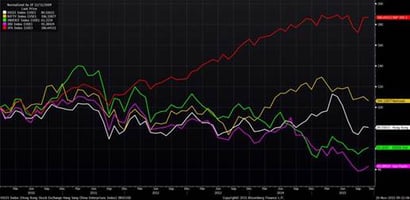
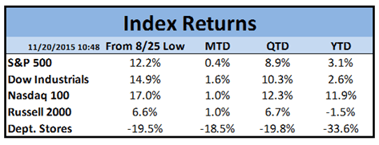
Index Returns
We have a new guest index today…Department Stores! As you can see, they have been pummeled this year, especially as of late. With such variance in performance between industries this year, I expect that year-end performance of investment managers will be quite dispersed.
