Jobless Claims
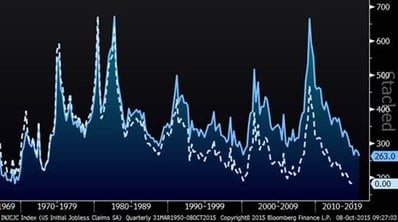
Last week’s initial jobless claims were the lowest in 42 years as shown in blue in the chart below. The reading garnered headlines on its own, but if you think about the fact that the population has grown a lot since then and look at this based on population (the white dotted line), it is clearly the lowest ever (or at least since they started calculating it in 1967). For those of you who look very closely at these charts, you will notice the population adjusted series doesn’t make it all the way to the right side of the chart…this is because the census data only goes to the end of 2014. On a related note, last night on Facebook I saw two different people who had posted something saying their companies needed workers. Could we be approaching a labor shortage and wage inflation?
Initial Jobless Claims – Nominal and Population Adjusted (Since 1967)

Job Openings
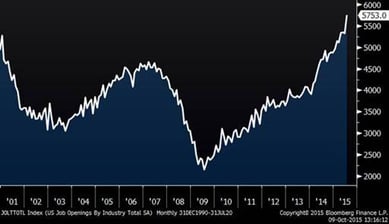
The chart below shows that job openings are at their highest level since the series began. As you can see, job openings have been moving strongly higher. Have we reached “full employment?”
Job Openings Since 2000

U.S. Dollar
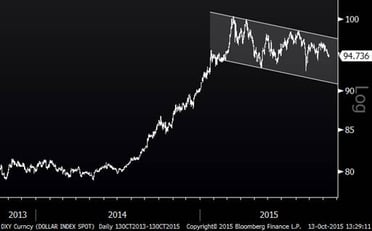
Everyone has been talking about the stronger dollar and most people seem to be under the impression that it has been continuing higher all year. At least based on the Dollar Index, which is the most popular measure, the US Dollar has actually been trending down for nine months.
US Dollar Index (Two Years)

Oil
Like the Dollar, the major decline in oil prices was last year. Since the beginning of the year, counter to what the general population would likely guess, oil prices are flat for the year:
Oil Prices (Two Years)

Is the Fed falling behind the curve?
We know that the health of the labor market and inflation are two critical inputs regarding Fed rate decisions. Most indicators (including those above) are now showing that we are at or near full employment and some businesses are already reporting wage inflation. Overall inflation has been tame, but there has been a strong tailwind of lower oil prices and commodities along with a higher dollar which has made imports cheaper. On a year-over-year basis, which is how inflation is normally measured, it is likely (barring a major move) that oil and the Dollar will soon be a neutral inflationary force at best, and perhaps additive to inflation. At the same time, it is quite possible that wage inflation will accelerate, given the tight labor market. I know the consensus question is “Is the Fed too early if they raise rates now?”, but maybe the better question is “Is the Fed already falling behind the curve in raising rates?” ...only time will tell.
Market Indices
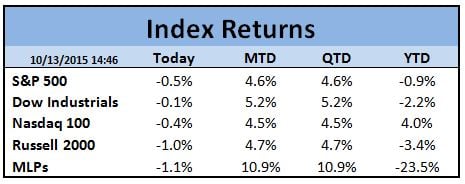
So far this week, the market has been relatively flat. Month-to-date, however, stocks have been quite strong and on a year-to-date basis, it varies greatly, depending on sector.


