Happy Anniversary!
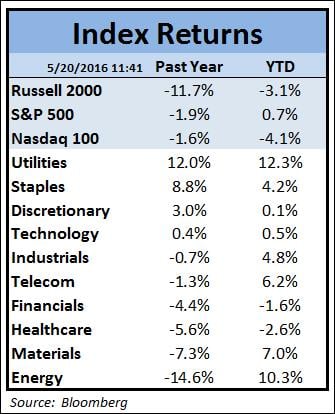
Today marks a one-year anniversary for the market. One year ago today, the S&P 500 hit its all-time high. As I just typed “Happy Anniversary!”, I am reminded that today is my 16th wedding anniversary too. What a coincidence! Anyhow, looking at the table below, you will see that while the S&P 500 is slightly down in the year since its peak, sector performance is quite dispersed, and the Russell 2000 – an index of smaller capitalization stocks – is down considerably. So, investors’ returns over the past year have been much more about which parts of the market they were invested in rather than just being invested in the market. MORE: An Unhappy Anniversary for the Market
 Sharing Economy
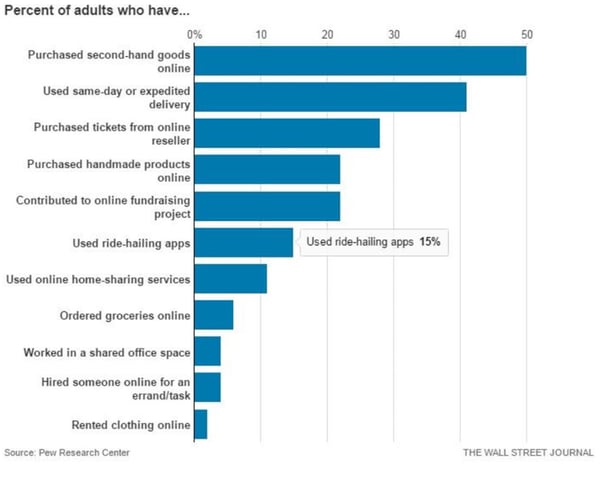
I came across the chart below in a Twitter post from the Wall Street Journal. As someone who thinks the “Sharing Economy” is changing many industries, I was surprised to see such low numbers of engagement in some categories, especially ride-hailing apps. I suppose it may be partially due to the fact that these services are not available everywhere and only certain demographics have a clear need for it. As far as renting used clothing goes…huh?

Black Gold
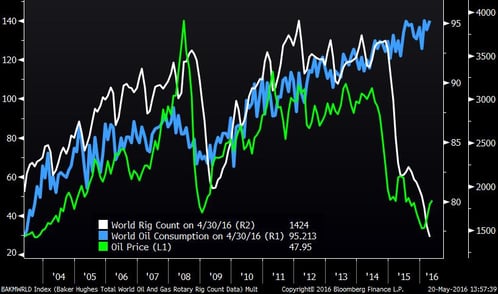
Energy prices certainly are a hot topic these days. The chart below shows worldwide oil consumption, rig count and the price of oil. Not surprisingly, rig count has closely followed oil prices over time – this time around has been no exception. What I am not sure everyone realizes is that oil consumption (the blue line) has remained quite consistent over time and has been growing on a similar trajectory for many years. It will be interesting to see what happens to oil prices in the next couple of years, but a driver of that will NOT likely be a change in the behavior of oil consumers. MORE: India Surpasses China as Leader in Oil Consumption Growth
Oil Consumption, Prices, and Rig Count (Since 2003)

Capacity Utilization
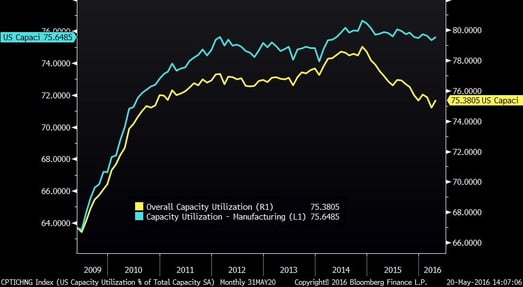
Overall Capacity Utilization has been down over the past eighteen months. Those in a more bearish camp say that this suggests that the U.S. is entering a recession. Those with a more positive outlook say that the decline is mostly due to energy and that things are better than they seem. The chart below shows overall Capacity Utilization, which includes energy, and Capacity Utilization within the manufacturing sector, which does not include energy:


