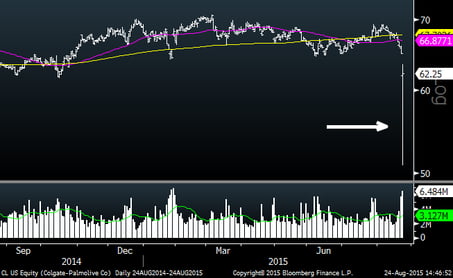
You will undoubtedly hear on the news and read about how the Dow was down over 1,000 points at one point today, so I will not regurgitate that information. What you might not read is that today was reminiscent of the 2011 “Flash Crash” for many stocks. On the open, a number of well-known stocks dropped twenty percent or more. Stocks like GE, Colgate-Palmolive, Boeing and Starbucks all experienced major, albeit brief, collapses. Below is a one-year chart on Colgate-Palmolive. Note today’s movement on the far right of the chart. This stock went from mid-sixties to $50 and back to mid-sixties all by 9:36 am. Now that this is the second “flash crash”, it appears to be a flaw in the market which has likely been exacerbated by automated and ETF trading. It is hard to argue that the market is efficient and orderly when huge, usually non-volatile stocks can move up and down twenty percent in a five minute period. Some illiquid ETFs were down as much as 40% this morning. My guess is that like last time, many of these trades will be reversed by regulators.
Colgate Palmolive (One Year)

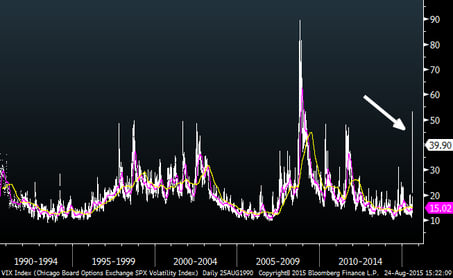
VIX
The VIX, which is widely used as a sentiment indicator, has been spiking. What I find most interesting is that today it reached its highest level ever, outside of 2008-2009. This shows just how fearful this move has been. USUALLY, major spikes in the VIX like this have coincided with low points in the stock market.
VIX (20 Years)

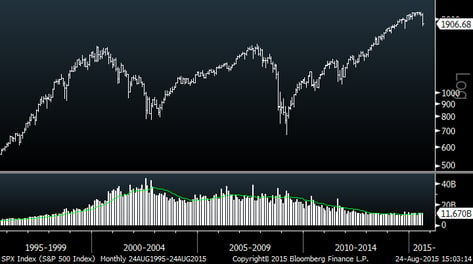
How does this decline measure up?
As extreme as this move feels and as much as the media is talking about it, I thought it might be useful to compare the current decline with those of the past. The chart below shows the S&P 500 over the past 20 years. So far, the current move is barely discernable within the context of the major moves of the past.


