Favorite “Blue-Chips”
Yesterday, I mentioned that dividend paying stocks have been a bit weak most recently and that it is possible that rising interest rates might be a headwind for these stocks. I received some responses from people mentioning specific high-quality names that they like, regardless of interest rate movements. I thought it would be interesting to look back to see what a group of “blue-chip” stocks has done over the last twenty years, which is presumably a long-term period for most investors. I used the Dow as a simple representation of what people think of as being “blue-chip”. The worst of these stocks, DuPont, still turned $1 into $4 and returned 7.1% on an annualized basis. Apple, which is clearly an anomaly, turned $1 into $88 and achieved a 25% annualized return. Of course there is a bias in this list, since they occasionally replace the losers with winners. Is your favorite long-term holding on this list? Does it rank higher or lower than you expected over the past twenty years?
Chinese Pharaoh
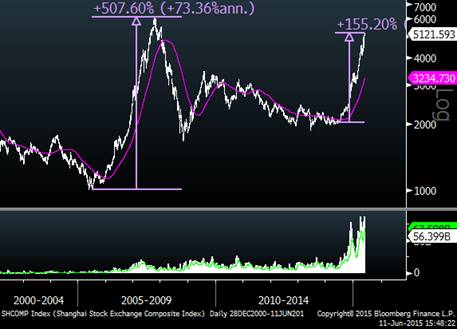
Stocks in China have been off to the races like American Pharaoh with the Shanghai Composite Index rising over 150% in the past year. This move looks very similar to the move from 2005-2007, except that in 2005-2007, the index rose over 500% before topping out and the rally lasted over wo years. Using the 2005-2007 as a guide, the current move is not even half way around the track. Of course, the most logical theory here would be that this move is clearly unsustainable and that this will end badly. After all, the market always follows the most logical path…right?
Shanghai Composite (Since 2000)

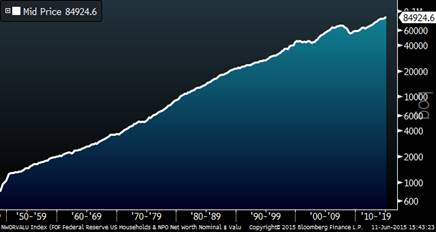
American Net Worth
There are headlines out today that Americans’ net worth has risen to new all-time highs. While the media made this sound very exciting, this series is not adjusted for inflation or population changes, so it almost always trends upward. As you might guess, the stock and housing markets are two major inputs into this statistic. Interestingly, as the chart shows below, throughout all of the economic cycles over the past seven decades, only during one of these periods did American net worth measurably fall: 2008-2009.


