Fact Du Jour
One-third of the Fed district banks are run by Goldman Sachs alumni.
Retail Debacle
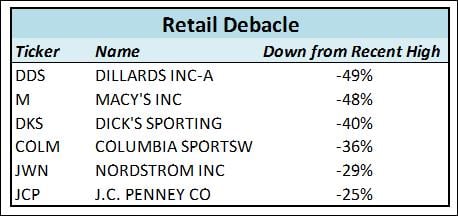
The stock market has been a “Tale of Two Cities” this year. Some stocks and sectors have done great, while others have been down significantly. As a whole, the consumer discretionary sector is up 10% this year. However, if you dig deeper, there are pockets of extreme weakness. One area that has caught my attention is retailers. Some of these stocks have been cut in half from their highs earlier this year. Today’s debacle is Dick’s Sporting Goods (DKS). Like other retailers, Dick’s said that the warm weather was a significant contributor to poor Q3 performance. A friend of mine in the business told me several weeks ago that the fall season was atrocious and companies like DKS would have a bad quarter. I thought this was likely already priced into these stocks…apparently not. The question for investors now is whether the weather is really the reason for the decline in many of these stocks and that this weakness is offering a buying opportunity, or if the weather is just a cover for deeper and longer lasting issues. The chart below shows several retail related stocks that have caught my attention as having been particularly weak recently:

Mortgage Delinquencies
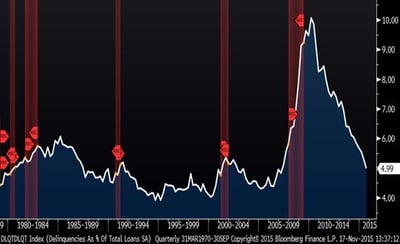
Not surprisingly, mortgage delinquencies have declined considerably since the housing crisis and are back near normal levels. Looking at a long-term chart and former recessions, it is remarkable how much different the last debacle was from other recessions. A lot of people are worried about the next recession and because the last one is freshest in their memory, they expect the next one to be like the last one. History would suggest this will not be the case.
Mortgage Delinquencies (Since 1979) with Recession Bands

Sector Returns
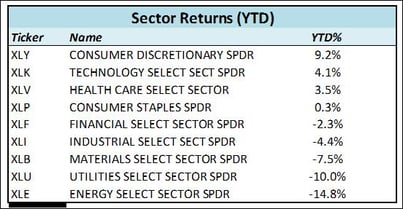
As I mentioned above, there has been a lot of variance between different sectors and industries this year within the stock market. The chart below shows YTD returns for S&P sectors. Within industries, it is even more varied.


