Biggest Product Launch Ever
Last week, Tesla started taking “reservations” for the new Tesla Model 3. The Model 3 is the new Tesla for the masses – the electric car that Tesla CEO Elon Musk believes will revolutionize the auto industry. It turns out that in the first week, as evidenced by the lines at Tesla dealers you may have seen in the media, Tesla received reservations for 325,000 model 3s. This number shattered expectations and represents $14 billion in sales, making it the biggest product launch in history, at least according to Elon Musk. Put another way, the rest of the industry sold 90,000 units in the U.S. in 2015. Maybe they need to start applying surge pricing on Teslas to balance supply and demand…haha. What is unknown at this point is how many of these reservations will convert to sales and how much difficulty Tesla will have in delivering all of these vehicles. MORE: Everything you want to know about the Tesla Model 3
Eager consumers waiting in line in the rain to reserve Model 3

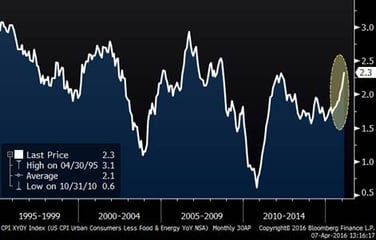
Inflation is accelerating
Core inflation is now at its highest level since 2008. This has not been highlighted widely in the media and is not yet alarming, but it is definitely something to pay attention to. Additionally, oil is up almost 50% in the past two months. If the current levels prevail or continue higher, increased energy prices will make their way in to the broader CPI as well. There are lots of arguments being discussed related to what the Fed should do, with most people saying they should not raise interest rates; higher inflation would work against that argument. More: Is the Fed losing sight of Inflation?
Core Inflation (20 Years)

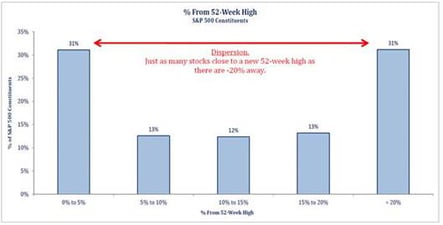
Market Dispersion
Many market participants like to guess where the S&P 500 is headed and allocate their money accordingly. In the past year, however, dispersion within the market has been unusually high. This dispersion creates opportunities for equity portfolios invested in the right stocks and sectors to outperform, but also creates downside surprises in portfolios invested in the wrong stocks and sectors. I have discussed this and have shown tables in recent blogs, but the chart below, compliments of Strategas, shows the aforementioned dispersion in a different and interesting way:

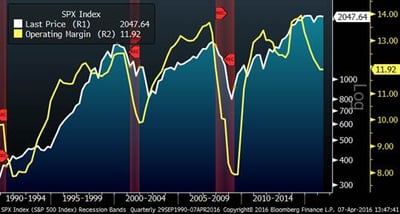
Operating Margins and Recessions
In the past two years, operating margins for the S&P 500 have been falling. Historically, significantly declining operating margins have corresponded with bear markets and recessions. Is this time different? One might argue that the major drop off in energy related margins is skewing this reading, but nonetheless, it is something to ponder. In the chart below, the yellow line represents operating margins, the other line represents the S&P 500 level and the red bars reflect recessions. MORE: Profit margins could be pointing towards a recession


