Correction or Bear Market?
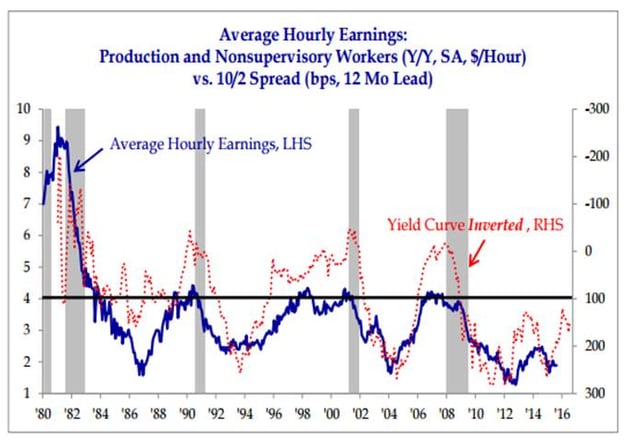
One of the biggest questions facing stock market investors going forward is whether the recent weakness is a healthy correction like 2011, or the beginning of a bear market, like 2001 or 2008. Obviously no one knows the answer to this, but below are a couple of charts that look back at data during previous recessions and bear markets. In the first chart (below) provided by Strategas, the blue line shows wage rate growth over time. As you can see, wage inflation of 4+% preceded every recession since 1980. Currently, wage inflation is a mere 1.9%.

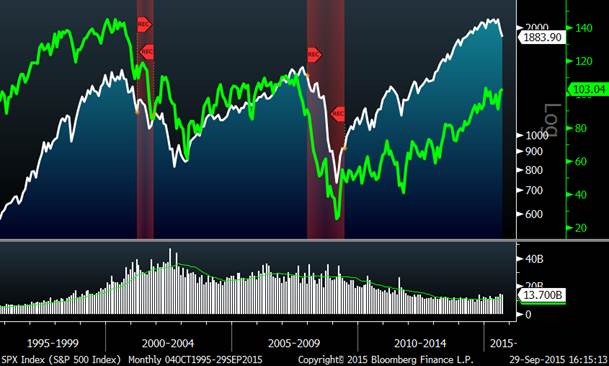
The chart below shows the S&P 500 in white and Consumer Confidence in green. As you can see, these two series are usually highly correlated, with consumer confidence dropping before a recession and in unison or before the stock market. In today’s case, while we have experienced a fairly sharp stock market decline, consumer confidence has remained strong and even increased in the face of market weakness.
Consumer Confidence (green) and the S&P 500

Amazon Flex
As you may have figured out by now, I love new technologies like Tesla, Uber and others. In fact, I vowed to someone yesterday to never again ride in a taxi….we’ll see if that is possible. Yesterday, Amazon launched what is essentially a delivery service version of Uber: Amazon Flex. Independent contractors use their own car and deliver Amazon Prime orders whenever they feel like it. I wonder if there will be surge pricing like Uber? Interestingly, Amazon said that participants must have an Android phone, not an iPhone.

Market Returns
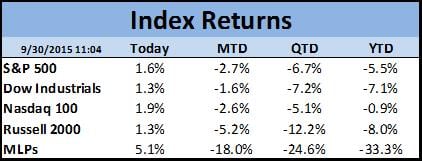
In response to popular demand, I will be inserting the table below into these blogs from now on. The data (sometimes will be as of midday) shows the major market indices along with a theme at the bottom which has caught my attention. As you undoubtedly already know, the major indices have been very weak lately, with the S&P trading down almost 7% this quarter and down nearly 6% for the year. Some areas like energy stocks and MLPs, which are represented at the bottom of the table, are down significantly more than the market as a whole.
Looking back over the past fifty years, Q3 2015 was the 26th worst out of 200 quarters. Looking at all quarters down 5% or more, 40% of those were during the third quarter; only 20% of those were fourth quarters.


