Big Tech Boom
Microsoft, Amazon.com and Google all reported earnings last night and all beat expectations. Many, including myself, believe that we are in the early innings of a new technological revolution. Unlike past revolutions where new companies displace the complacent incumbents, it may be that this time around the incumbents (Amazon, Facebook, Google, Microsoft, Apple, etc.) actually lead the way into the new paradigm. These companies have scale, massive R&D budgets and are so far leading the way in artificial intelligence, cloud computing and big data. Here are some factoids related to today’s big moves in these stocks:
- $130 Billion – The increase in value of Amazon.com, Google and Microsoft just today.
- $11 Billion – Jeff Bezos’ increase in wealth today. He is now the richest man in the world. On a related note, the two richest humans both live within 1.5 miles of each other in a mid-sized U.S. city.
- 34% -- The year-over-year revenue growth for Amazon. This represents an acceleration of revenue growth and is incredible considering the scale of this company.
- FedEx – The equivalent market cap that Amazon.com is adding today.
MORE: Big Tech Crushes Earnings
Interest Rates
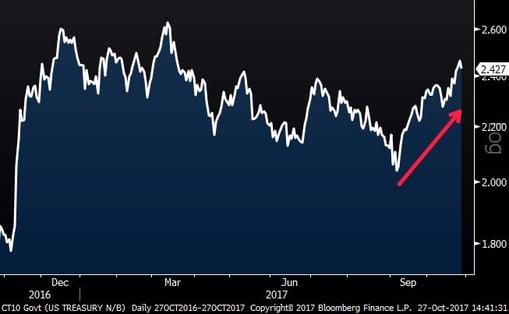
There is more and more talk about rising interest rates. Many believe we have finally reached a turning point and that rising rates will eventually be bad for the market and the economy. As you can see below, the 10-year U.S. Treasury yield has been increasing for the last two months:
10-Year Treasury Yield – One Year
GE and The Dow
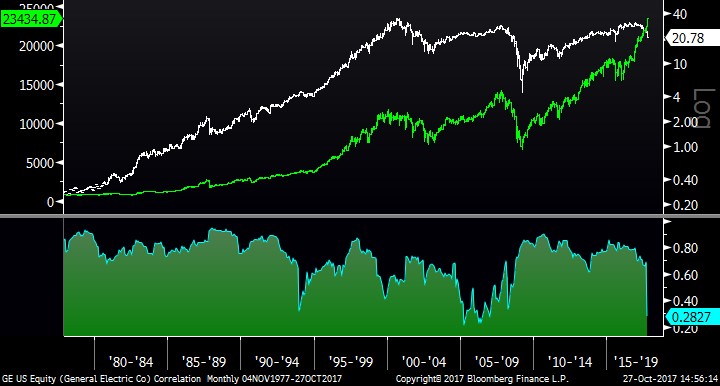
GE is the oldest component in the Dow Jones Industrial Average. It has always been a bellwether of the economy and has exhibited high correlation to the overall market – until recently. This year, it is down 32% while the market is up strongly. The big question is whether GE has seen its day, or if they will bounce back like other times in the past. The chart below shows GE versus the Dow. The lower half illuminates the fact that GE’s correlation to the Dow is near the lowest ever. It is also notable that this stock is actually down since 2000. RELATED: GE's Struggles Put Its "Blue Chip" Status in Jeopardy
GE and the Dow (40 years)

Commercial Bank Drought
I saw this chart from Strategas the other day. It is amazing that there have been almost zero new commercial bank openings since the financial crisis. There are still lots of banks out there, but that number shrinks every year.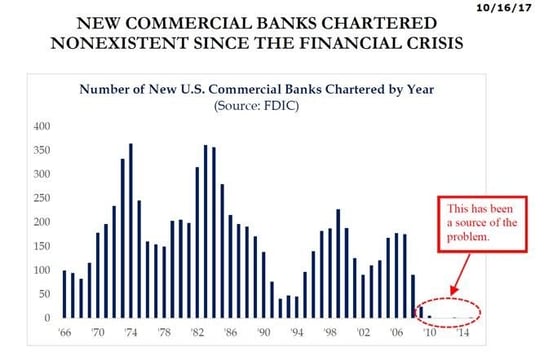
Pumpkin Roll
The 2017 Pumpkin Roll is in the books, so your pumpkins are safe! If you don’t know what I am talking about, check out this video of a long-standing Halloween tradition in my home town: 2017 Pumpkin Roll