October to Remember
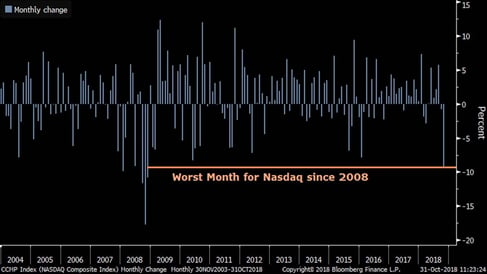
Even with the bounce over the past two days, this month has been the worst month for the Nasdaq since 2008, which was the worst period for the stock market since the Great Depression. The big question investors are now pondering is whether the party is over for tech and the market in general or whether this is just a healthy market correction. READ MORE: Red October Sees US Stocks Endure Worst Month Since Financial Crisis
Monthly Nasdaq Performance (15 years)
Traders were asked about the recent action in the equity markets and had no comment (see below):

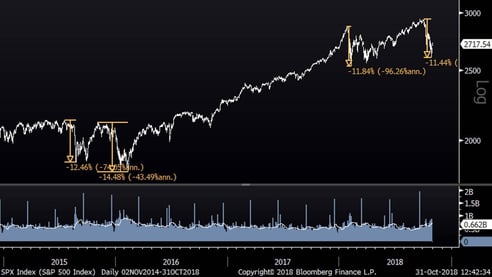
How Unusual is this Move?
The recent move in the market has been steep and quick. To many, it feels worse than other recent moves. Looking at just the last three years, this is the fourth such move. While it may feel very unusual, there have been four similar drawdowns since 2015. Of course, many are saying “yeah, but this is different” – time will tell. It is worth noting that in the new world of automated trading and massive ETF holdings, the nature of market moves has changed. Emotional selling is now as easy as pressing a button to sell ETF holdings, or in some cases a computer automatically sells when certain conditions are met. This helps cause the “air pockets” that we experience in market corrections now. The new normal is for the market to “take the stairs on the way up and the elevator down” – October has proven to be an elevator ride.
S&P 500 Drawdowns Since 2015
Atlas Robot
Those of you who have read this blog for a while might remember me sharing an interesting video from Boston Dynamics showing their robot doing a backflip and some other unbelievable, albeit slightly clumsy, moves. Check out this video to see how much the technology has advanced in just a year or two: WATCH: Boston Dynamics Atlas Robot While this is cool and amazing to watch, it illuminates an important secular trend – technology is advancing at an unprecedented rate and artificial intelligence is at the core of this revolution. This, of course, has meaningful investment implications too.

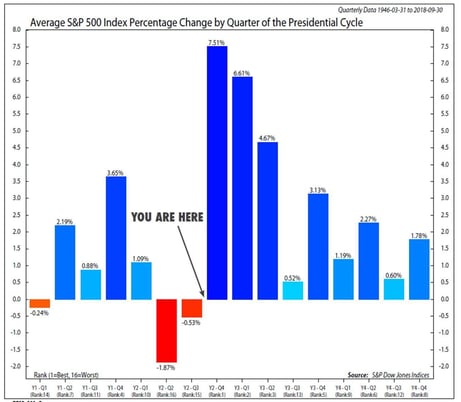
Presidential Cycle
The chart below from the Ned Davis Research Group shows the typical S&P 500 performance over each quarter of the presidential cycle. There are always exceptions to the rule, but the presidential cycle is transitioning from what are typically the worst two quarters into the best three. Is this time different?
Have a great day!