Market Volatility
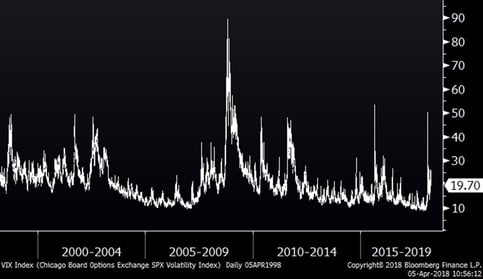
As I have mentioned in previous communications, 2017 was not a “normal” year when it came to volatility. In fact, it was one of the lowest volatility years on record. More normal volatility was bound to return – and it has. To some, this newly found volatility feels unusual, but spikes in volatility like this are very common over time. The chart below shows the Volatility Index over the last twenty years. As you can see, episodes like this have occurred at least every two years on average. MORE: Dueling Tariff Announcements Blamed for Stock Market Volatility
Root of the Volatility
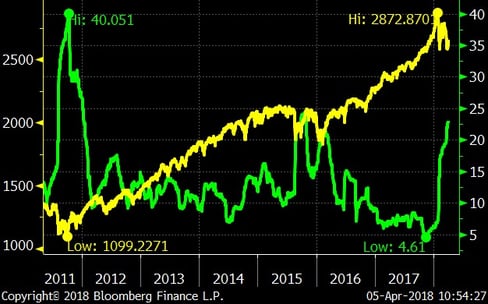
Over the last couple of years, the stock market has overcome other apparent hurdles and it has been “smooth sailing” since early 2016 – so why now? Market volatility rises when uncertainty and fears arise. There is a growing concern related to higher interest rates, which was the driver of the first round of weakness back in February. Now there have been two issues that hit right in the heart of the stock market: the potential of a trade war with China and a direct attack on what has become the core of the stock market – big tech, and specifically Amazon.com. As usual, the market is not reacting to actual results or events, but fears of the unknown. The chart below shows trailing 50-day market volatility (green) and the S&P 500 (yellow) over the last seven years. As you can see, other periods of increased volatility have corresponded with low points in the market, so maybe there is hope for the stock market after all?
Volatility and the Stock Market (7 years)
Stock Market Scorecard
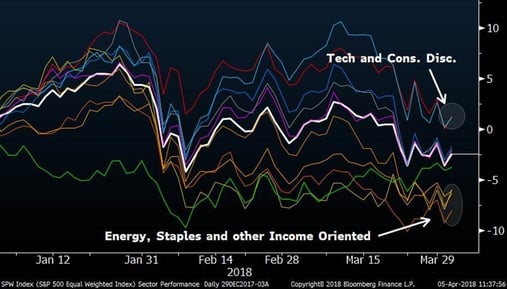
Looking at sector-based performance for the year gives us a good reading on what is going on in the market. The chart below shows the performance of each sector in the S&P 500 so far this year. At the bottom of this chart, we see the “safer” dividend-oriented sectors, with consumer staples leading the way down. This is the opposite of what most would expect in a higher-volatility environment. I attribute this largely to the premise that the market is worried about higher rates, and higher rates mean that dividend yields become less attractive as fixed income alternatives become more attractive. On the upside, even with the recent scrutiny, technology stocks are leading the way – again, not what econ 301 taught us should be happening during a period of increased worry and volatility, right? So why is consumer discretionary strong? Guess what, this sector has a concentration in Netflix (up 55% this year) and Amazon.com (up 24% this year), which are propping up the broader sector. The moral of the story here is that conservative or dividend-oriented portfolios are among the worst performing this year, and those concentrated in technology have likely done much better.
Sector Performance (YTD)
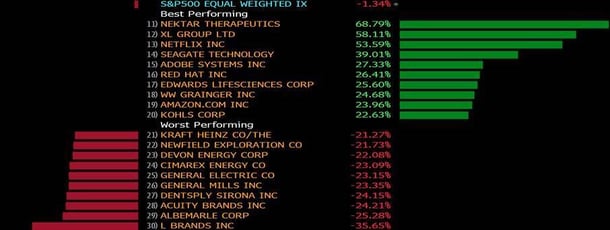
Biggest Movers
Since I just covered the sectors, I thought it would be interesting to look at the best and worst performing S&P 500 stocks year-to-date. One can see the same themes in this table (from Bloomberg) as the chart above.