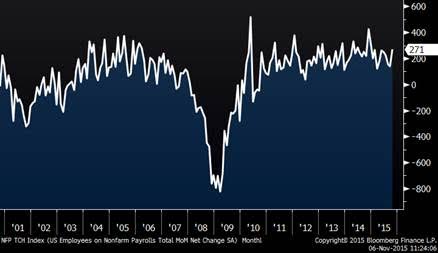
Non-Farm Payrolls
Non-farm payrolls for October were much better than expected, coming in at 271,000 versus an expected 185,000. This means that market was up today and that people were applauding the surprisingly strong economic data, right? WRONG! Conversely, the market digested it as a signal that the Fed will increase rates sooner rather than later, which is theoretically bad for most stocks. Looking into the specifics, high-income stocks like REITS and Utilities were down the most, and Financials were relatively strong. Further, the dollar moved strongly higher on this news, which is a negative for the materials and energy stocks.
Non-Farm Payrolls (15 years)
Interest Rate Hike
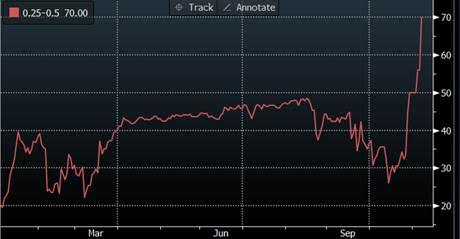
Below is a chart of the implied probability of the Fed raising interest rates in December. As you can see, this measure has recently skyrocketed:
Implied Probability of Fed Rate Hike in December
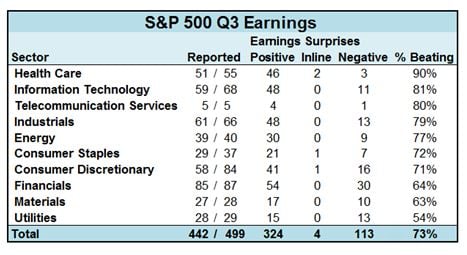
Q3 Earnings Scorecard
The table below shows Q3 S&P 500 earnings by sector. As earnings season winds down, every sector has seen more companies beat expectations than miss. Perhaps the Q4 market strength has something to do with the unexpectedly good earnings. I don’t have the data at my fingertips, but I know that revenues were not as strong as the earnings shown below.
The Experts
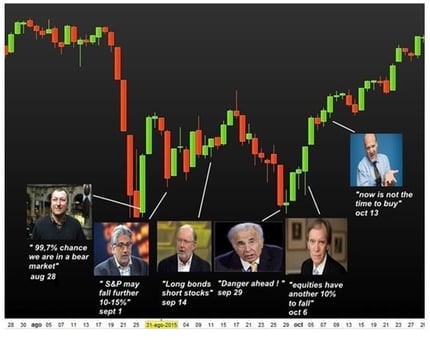
Someone forwarded the chart below to me. It suggests that as usual, the “experts” and the media were very bearish after the Aug/Sept decline. Meanwhile, the market has experienced a double digit advance since the lows…
Nasdaq 100
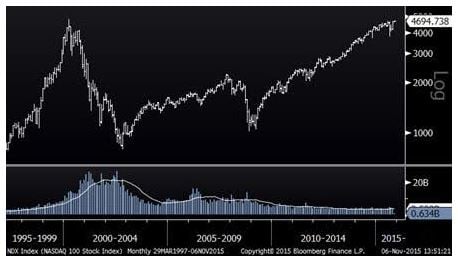
The Nasdaq 100 is at new multi-year highs and close to all-time highs. It is amazing that it has taken fifteen years for this index to overcome the losses of 2000-2003. To most people, this implies that if they had been invested in a collection of NDX 100 stocks back then that they would finally be back to break-even if they had held them throughout the years. This is NOT the case. Since the index is constantly kicking out the losers and adding winners, the performance of the index is much different than buying and holding the underlying securities. CLICK HERE to look back at some of the Nasdaq 100 changes back in time. You may not recognize many of these companies, and in fact, some do not even exist today.
Nasdaq 100 – Since 1997
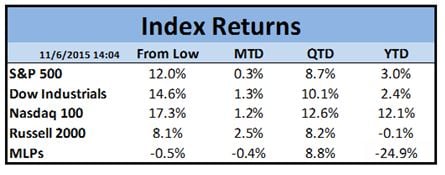
Index Returns
