Recession?
Every day, I hear the constant debate about whether the U.S. is going into a recession. If it does happen, it will be the most telegraphed recession in history. Interestingly, four states are already in a recession – Wyoming, South Dakota, Alaska and West Virginia. This is not surprising, as all of these states are highly exposed to energy in one form or another. Read More: Recession Already Reality in Spots.
The pockets of recession make me think of Williston, North Dakota. Williston is ground zero for the fracking industry and the population was exploding until the bottom fell out of oil prices. It was such a phenomenon that several documentaries focused on the new boomtown and the dark side that its unprecedented growth had brought with it. Today, the town has an emptier feeling. Read more here about the decline from The New York Times. The image below illuminates how hot the North Dakota shale oil boom had become. This is a satellite image of the U.S. at nighttime in 2013. For the most part, this map makes a lot of sense; all of the major cities are bright spots and most of the west is dark. BUT…What is that huge city that is bigger than L.A. and Chicago in the middle of prairieland? It turns out that this is the light from the Bakken oil fields.

Is the Market Cheap?
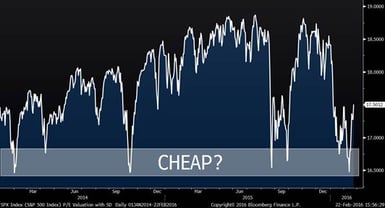
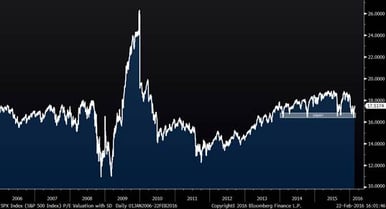
There is a piece out from a sell-side firm talking about how the market has been unwilling to let the S&P 500 trade below a 16.5-17 PE range and that the market finds this level to be “cheap”. While this is true over the past two years, as shown in the chart below, if we look further into the past, the story is a bit different. In case you cannot read the band in the second chart, it is actually the same exact band as shown in the first chart. The only difference is the timeframe being considered…funny how that works.
S&P 500 P/E Ratio Since 2014
S&P 500 P/E Ratio (Ten Years)
Housing Prices
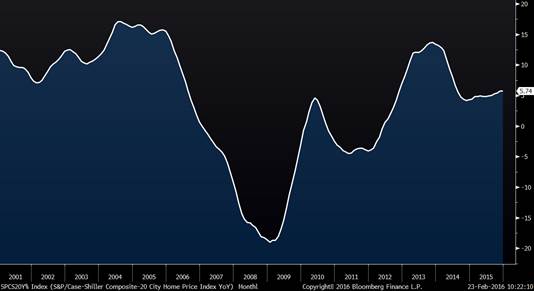
Case Shiller released its home price data for the period ended in December. Nationally, prices grew 5.74% on a year-over-year basis, reflecting a “Goldilocks” environment where prices are not too hot, but not too cold. There were some areas, all of which were west of the Mississippi that grew at double-digits and the weakest areas were Washington, Chicago and Cleveland. Most recently, some of the related stocks have traded down on fears that economic recession will derail the housing recovery, but so far, the data is still strong. Click Here for Housing Heat Map
Case-Shiller 20 City Home Price Index (YOY ∆%)
Consumer Confidence
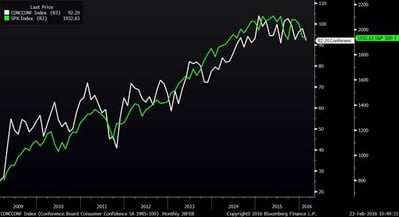
The media likes to highlight consumer confidence as an important indicator. Today’s reading for February was indeed down a little and was the worst reading since last summer when the stock market weakened. Looking at the chart below, you will see that consumer confidence tends to move in unison with the stock market, so essentially it is only answering the question “How has the stock market been lately?”, which everyone already knows.
Index Returns
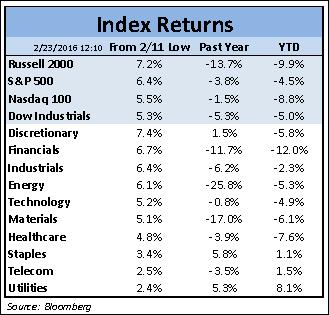
It has definitely been an interesting start to 2016. Like 2015, this year has been characterized by dramatically different sector returns. We are only in February, and financials and utilities differ by 20%. Not surprisingly, the 8.1% return in utilities is the strongest since the ETF data started in 1998. Another interesting thing about the table below is that energy stocks are no longer an outlier; since the February market low and YTD, energy stock performance is within the range of other sectors. Could this be a sign that the tide is changing for that group?
