Elkhart, Indiana
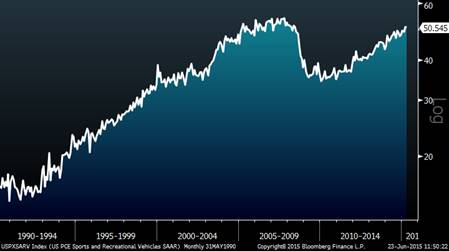
For some reason, Elkhart, Indiana and RVs have come up in several conversations lately. I am hoping that at least one reader of today’s blog is actually in an RV on summer vacation. Many of you have probably driven through Elkhart and passed the RV Hall of Fame (yes that really exists). Elkhart is the RV capital of the world; more than 1,000 RV related companies operate in Elkhart and half of the RVs you see on the road were made in this rural Indiana County. Elkhart is also the band instrument capital of the world for those of you studying for Jeopardy. The chart below shows RV sales over the last 25 years. Not surprisingly, the industry took a massive hit in 2008, but has recovered all the way back to peak levels seen back in 2007. With the baby boomers all retiring, one would think that demographics are a tailwind for the RV industry. Thor Industries (THO), the largest pure play in the space, took advantage of the recession and is now achieving record sales and earnings. Interestingly, the company is not yet back to peak profit margins.
RV Sales (25 Years)

Existing Home Sales
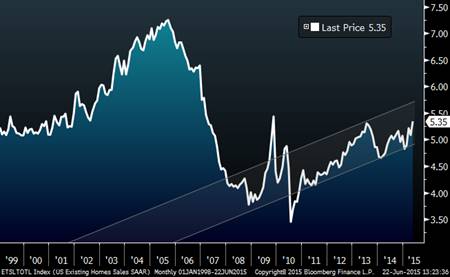
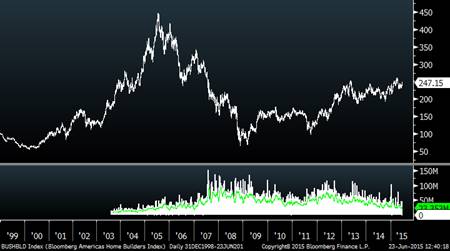
Existing home sales figures came out yesterday and were relatively strong. The housing market continues to recover, albeit not quite as quickly as the RV market noted above, which is probably a good thing. Looking at the actual homebuilding stocks (bottom chart), they have mostly tracked home sales and as a group are nowhere close to their bubble peaks. This suggests to me that the market is recognizing the recovery in the housing market, but isn’t completely convinced yet that the recovery is or will be extremely strong.
Existing Home Sales (since 1999)

Homebuilding Stocks (since 1999)

Wall Street
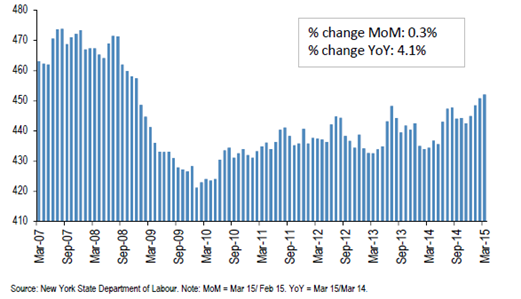
On the same theme of measuring the magnitude of the recovery, I recently came across the chart below. This measures the number of people working in financial industry in New York City. It is interesting how similar this looks to the housing charts above. Although the overall market has reached new highs and the financial industry is booming again, the number of workers on Wall Street has not fully recovered. My guess is that some of this has to do with technology and that investment professionals increasingly can work from satellite offices away from Wall Street. Any thoughts?
Number of Financial Employees in NYC


